
Advantages of Fundamental Analysis in Forex
Whether you are a retail day trader or a professional trader, or an institutional trader/investor, the foreign exchange (forex or FX) market is where the bulk of the money lies. Daily average volumes of transactions in the bond market are $700 billion worldwide. In comparison, the equity markets amount to $200 billion.
These amounts are relatively small for a forex trader since the daily average volume for forex is approximately $5 trillion per day. The Forex market is the biggest, most traded exchange globally. Market participants include governments, central banks, commercial and investment banks, multinational companies, individual forex traders and speculators. For this reason, FX trading can involve risks.
Forex is a marketplace for trading in currencies. Forex traders could speculate and trade on currency prices fluctuation between two countries to profit in the forex markets. The rise and fall in these market forces create daily price movements that offer profit-making opportunities to a forex trader.
A forex trader makes choices based on their forecast of future trade flows related to demand and supply and predicts the future direction of a particular currency pair. For instance, a trader will buy (sell) or take a long (short) position if they deem the value of a specific country of the base currency will rise (fall).
However, the skill of forex takes time and experience to develop. A trader will need a combination of fundamental and technical analytical skills and knowledge of factors that influence price movements in a currency. Furthermore, a trader would require a comprehensive trading system with competent risk management forex trading strategies.
This article explains fundamental and technical analysis techniques for the forex market. In addition, it brings to light various forex trading strategies such as hedging, position trading, and scalping.
Fundamental Analysis techniques
There are two basic analytical techniques for forex trading – fundamental and technical.
Fundamental analysis trading generally utilizes long-term traders who buy (or sell) and hold a currency pair for an extended period. Fundamental analysis alludes to the examination of economic conditions, both within specific countries and globally.
During most trading days, several financial, trade and commercial reports, announcements, and data from the different countries in the world are released. The information, positive or negative, encompassed in the data revealed are drivers that cause exchange rate movements between currency pairs.
For example, positive reports regarding the United Kingdom's economy are likely to increase the value of GBP against other currencies like the EUR and USD at least in the short run. Data that is likely to impact currency prices and trade data flows include:
- GDP data (show economic growth & strength),
- Consumer and producer price index (show inflation),
- Employment and consumer confidence (show aggregate demand, economic growth & strength),
- The policy of the central bank (interest rates, buying and selling bonds, money supply).
Global economic trends could also influence the exchange rate. For instance, suppose a report indicates that the worldwide demand for cotton is expected to rise. Countries that are major cotton producers and exporters may benefit, and the value of their currency may increase.
It is vital to note that a single fundamental factor change alone may not always substantiate currency movement; it is a combination of them.
Interest rates are the biggest influencers of the currency movements. For example, investors can earn significant gains from holding money in interest-bearing accounts in the United States than from interests in other countries. Then that would deem the US dollar attractive, and its value relative to other countries is prone to increase.
The next big influencer is inflation. Economic theories such as purchasing power parity believe in the law of one price. PPP states that the spot exchange rate adjusts perfectly to inflation differentials between two countries. According to PPP, if the purchasing power between two countries is identical, then the exchange rates would be equivalent.
Suppose the price of a product increases in a country relative to another. In that case, the country's exchange rates must depreciate to maintain a similar actual price level. One can use the notion of PPP to forecast exchange rates in the long run effectively.
The PPP relation can be expressed as follows:
S1/S0=(1+IF)/(1+ID)
Where S0 is the market exchange rate at the start of the period (the foreign price of one unit of domestic currency), S1 is the market exchange rate at the end of the period, 1F is the inflation rate over the period in foreign currency, ID is the inflation rate, over the period, in the domestic country.
Technical Analysis techniques
Many traders prefer technical analysis to identify trading opportunities. Technical analysis examines historical price charts and market behaviour (such as volume or volatility) of a financial instrument to forecast future price trends. Speculators and short-term or intraday traders favour this type of analysis.
In addition, forex traders should consider technical indicators like moving averages and momentum indicators such as the relative strength indicator (RSI).
A simple technical forex trading strategies could be as straightforward as buying a currency pair when the exchange rate is higher than a 50-period moving average. Furthermore, selling the pair is lower than the 50-period moving average.
Several technical traders employ a single technical indicator for undertaking a trading position. In contrast, others look at numerous technical indicators as trade indicators.
For example, use a moving average, along with a momentum indicator such as the MACD. A day trader's time frame to analyze prices may differ according to his preference and strategy. Several traders analyze 1-minute, 5-minute time frame charts, whereas several prefer hourly, 4-hours, or daily time frames.
Support and Resistance levels
Support refers to a price point where a downtrend can be expected to break because of increased demand. As a result, the lower price creates substantial buying interest. Conversely, resistance refers to a price point when the prices are substantially high, generating a selling interest. The purpose of these points is to serve as indications for potential entry or exit.
Once the price climbs towards a support or resistance level, the price could bounce back away from them or violate it until it strikes the next support or resistance level.
Trading is based on the notion that support and resistance levels will not be violated. Thus, many traders decide whether price action will be discontinued at the support or resistance level or breach it.
The picture below shows a price chart with identified support and resistance points.
Candlestick Charts
Candlestick charts are simple forex trading strategies to identify price changes on a chart. A candlestick is made from the price action of a selected time frame. For instance, each candlestick on an hourly chart represents the price movements for one hour. In contrast, each candlestick on a 4-hour chart would demonstrate the price changes across every 4 hours. A picture is depicted below.
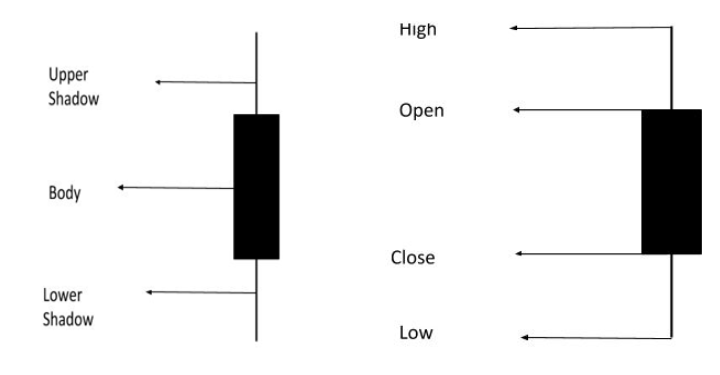
As you can find out, there are several components of a candlestick. They are:
- The Body
- Upper Shadow
- Lower Shadow
A candlestick has four notable data points:
- Open – the opening price at the beginning of the specified timeframe
- High – the highest traded price during the specified timeframe
- Low – the lowest traded price during the specified timeframe
- Close – the closing price trade at the end of the specified timeframe
Also, the body has typically coloured either Red or Blue. For example, suppose a blue candlestick body is formed. In that case, it insinuates that the closing price (top of the candlestick body) was greater than the opening price (bottom of the candlestick body); on the contrary, a red candlestick body implies that the opening price was greater than the closing price.
Many day traders use candlesticks (a single candlestick or a succession of multiple candlesticks) for detecting impending market reversals or investment trends shift while trading forex.
Technical Indicators – Moving Averages
In addition to studying candlestick charts, day traders can examine moving averages. Moving averages are widely applied forex trading strategies by retail investor accounts. As affirmed earlier, a simple forex trading strategies using a moving average could be buying a currency pair when the exchange rate is higher than a 50-period moving average. Furthermore, selling the currency pair lower than the 50-period moving average
Moving average crossovers are another repeatedly utilized technical indicator in the forex market. For example, a crossover trading strategy involves buying a currency pair after the 10-period moving average exceeds the 50-period moving average.
Moving average number and price movement is proportional to each other. For instance, price crossing higher or less than a 100- or 200-period moving average is deemed more significant than price movements higher or less than a 5-period moving average. Therefore, each trader must choose the time frame according to their goals while developing their forex trading strategies.
Technical Indicators – Momentum Indicators
Moving averages and candlesticks primarily focus on determining likely investment trends and market direction, up or down. Conversely, the momentum indicator's purpose determines the market's strength rather than the direction. Thus, they are considered advanced forex trading strategies.
The typical momentum tools applied by day traders in the foreign exchange market include the Stochastic Oscillator, the Relative Strength Index (RSI), the Moving Average Convergence-Divergence (MACD) indicator, and the Average Directional Movement Index (ADX). The strength of the price action tells the trader which movement is insignificant while day trading.
Momentum indicators gauge the trend strength; they serve as warning signals that identify if a trend is coming to an end. For example, suppose a currency pair has been trading a sustained high uptrend for several months. In that case, one or more momentum indicators signal the trader to close his position because the price movement is losing strength.
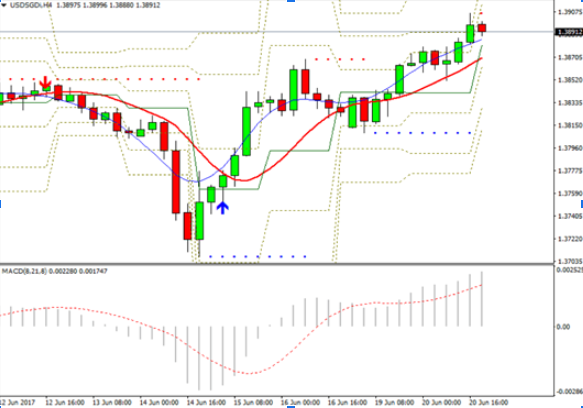
The 4-hour chart of USD/SGD in the picture above depicts the MACD momentum indicator. The MACD indicator is shown below the main chart window. There is a sharp reversal in the MACD around June 14th, insinuating that the price movement will be sustainable and robust rather than temporary.
When the price begins to move down around the 16th, the MACD reflects the price action is weaker. Soon after that, the price moves upwards; the change in the MACD indicator restores faith in day traders regarding price action's significance.Momentum indicators signify the strength of the price movement but not the trend direction. Hence they need to be coupled with other technical analysis indicators as part of an overall forex trading strategies.
Forex Trading strategies
Hedging
Hedging is a risk management strategy that could be used by forex traders while currency trading to mitigate risk by taking two opposite positions on one currency pair. This involves simply initiating a long and a short position on the same pair. Professional traders sometimes use two different currency pairs to make one hedge, but that is an advanced forex trading strategies.
For example, Sam, a forex trader, decides to short the US dollar against the Swiss franc (USD/CHF). However, after some time, Sam believes that the US dollar will strengthen, and the short may cause him to lose money rapidly. Hence, he decides to undertake a balancing act.
He observes that the EUR/USD pair moves inversely opposite to the USD/CHF. If the dollar strengthens, the EUR/USD is likely to move downwards.
Hence Sam takes a short trading position on the currency trade. With effective risk management Sam can cut the losses on his USD/CHF position and meet his profit targets with the EUR /USD trade
Position Trading
Position trading is a forex trading style that involves holding a position in currency pairs for a long time. It has perhaps the most extended holding period compared to other trading styles. The holding period may differ from a few weeks to years. Position trading is an extreme contrast to day trading since short-term price action, and market corrections in exchange rates do not influence a position trader.
Conversely, for this reason, position trading has some risks. First, an unexpected reversal in exchange rates could lead to significant losses. Secondly, the capital of the forex trader is locked in for an extended time. Hence it is less liquid.
Forex Scalping
In Forex, scalping involves making short-term trade for a few pips, usually using high leverage. Forex traders generally do scalping in concurrent market news releases and favourable technical conditions. The time horizon for scalping could range from a few seconds to hours. Many traders begin their forex trading with scalping since it does not take long to realize if a particular trade is a losing trade.
However, scalping is a risky trading strategy; the risk involved is disproportionately higher than the potential reward. Therefore, it is recommended by advisors to use forex scalping as a secondary trading strategy that should be used in combination with the overall primary trading strategy.
Swing Trading
Swing trading aims to exploit the upward and downward "swings" in asset prices. In the forex market, swing trading is used by forex traders to buy and sell currency pairs. Swing traders rely on complex technical indicators and advanced foreign exchange tools such as Fibonacci retrenchments, candlesticks, T-line trading charts. They use these indicators to identify if the currency pair possess momentum and identify when would be the optimal time to enter or exit a trading position.
The time horizon for swing trades may vary from a day to a few weeks. Swing traders seek to secure small wins within a bigger overall investment trend. For example, other traders might wait on for five months to gain a 25% profit, whereas swing traders could make 5% gains weekly consequently exceed the other trader's profits over the long-term.
Conclusion
The Forex market can be attractive for traders. Forex traders can open a trading account with as little as $100 and earn lucrative returns. However, the rewards come at a risk. The majority of retail investor accounts that trade forex loses money. Only a minority percentage can hit their profit targets and become successful traders in the currency trading markets.
The article explains several tools and advanced forex trading strategies that retail traders could apply. But the most critical factor that makes one a successful trader is assessing all options objectively while making a trade. It requires exceptional trading discipline, patience, and risk management. Advanced forex trading strategies involve using market movements to your advantage.
One should be able to make profits and control losses. Many professional advanced traders give the following investment advice; "avoid taking big losses until you stumble into a huge winner". Unfortunately, most traders end up losing money rapidly because they gamble their trading capital rather than making an informed decision. Hence, when the million-dollar trading opportunity appears, traders have no money left for day trading/investing.
There are several online trading platforms for trading currencies in the forex market. ETFinance is one such platform that provides a secure space for trading CFDs in Forex at 0% brokerage and transaction fees. ETFinance has an array of trading products that encompass CFDs of stocks, indices, forex, commodities, cryptocurrencies along with other securities.
CFDs are complex instruments, hence one should take investment advice before indulging them. CFDs are leveraged products that do possess high risk. Retail traders must educate themselves regarding the products or risk making money losing trades.
ETFinance has an excellent platform that includes a variety of educational tools that can empower new traders to make informed financial decisions. Hence, open an account and get started now!
Advantages of Fundamental Analysis in Forex
Source: https://fxreviews.best/blog/advanced-forex-trading-strategies/
0 Response to "Advantages of Fundamental Analysis in Forex"
Post a Comment